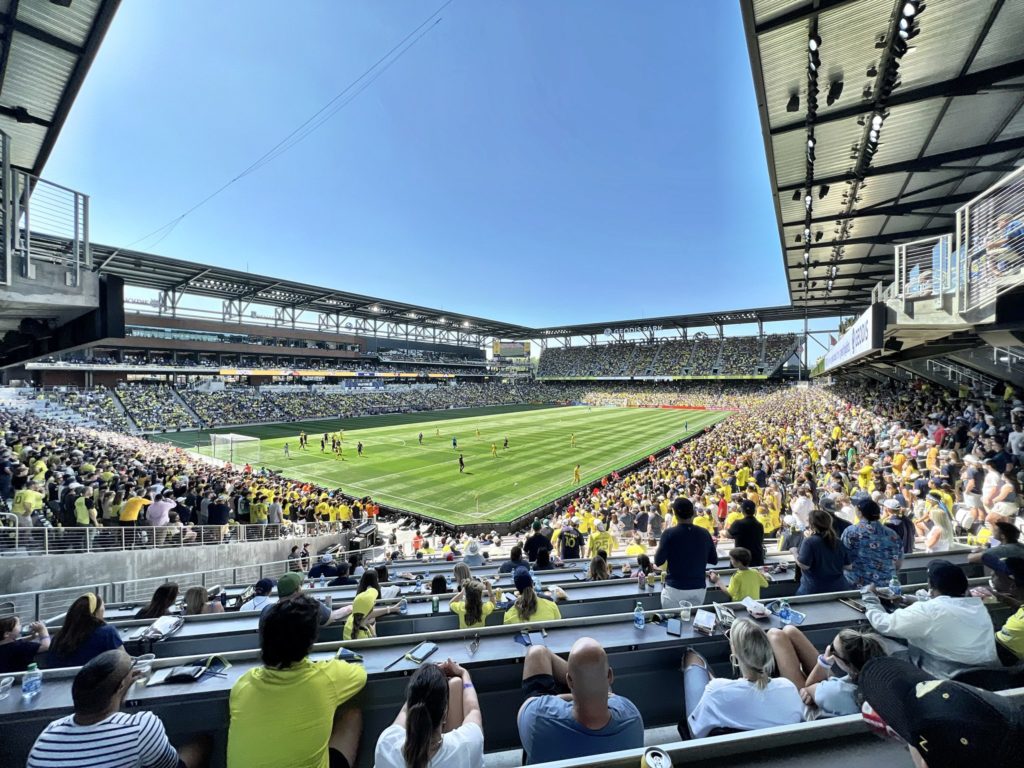
We saw a strong close at the gate on the 2022 MLS attendance front in Week 34, led by good crowds for Orlando City, DC United, Houston Dynamo and New York Red Bulls matches.
These are not the final 2022 MLS attendance numbers, as numbers for seven six two matches over the course of the season are not public, and we’ve reached out to team PR officials for the results.
Overall, MLS attendance is up 25 percent over 2021 attendance. The trend toward normalcy continues, as this year’s numbers reflect the state of things in 2018 and 2019, when 21,873 fans per game attended MLS matches.
These 2022 MLS attendance numbers are current as of Oct. 11, 2022. They are based on the MLS website, in-game announcements and media reports.
| Team | Av. | Total | Gms | 2021 | YOY | W34 | |
| 1 | Atlanta United FC | 47,116 | 800,966 | 17 | 43,965 | 0.07 | 43,312 |
| 2 | Charlotte FC | 35,260 | 599,428 | 17 | N/A | N/A | 34,122 |
| 3 | Seattle Sounders | 33,607 | 571,318 | 17 | 25,125 | 0.34 | 33,910 |
| 4 | Nashville SC | 27,554 | 468,419 | 17 | 19,172 | 0.44 | |
| 5 | Toronto FC | 25,423 | 432,190 | 17 | 8,733 | 1.91 | |
| 6 | Portland Timbers | 23,841 | 405,305 | 17 | 21,285 | 0.12 | |
| 7 | LA Galaxy | 22,841 | 388,302 | 17 | 13,400 | 0.70 | |
| 8 | FC Cincinnati | 22,487 | 382,274 | 17 | 21,175 | 0.06 | |
| 9 | LAFC | 22,090 | 353,441 | 16 | 20,204 | 0.09 | 22,205 |
| 10 | Austin FC | 20,738 | 352,546 | 17 | 20,738 | 0.00 | 20,738 |
| 11 | Real Salt Lake | 20,470 | 347,991 | 17 | 15,253 | 0.34 | 21,333 |
| 12 | NE Revolution | 20,319 | 345,418 | 17 | 18,861 | 0.08 | |
| 13 | Minnesota United | 19,555 | 312,879 | 16 | 14,326 | 0.36 | 19,941 |
| 14 | Columbus Crew | 19,237 | 327,027 | 17 | 16,344 | 0.18 | |
| 15 | Sporting KC | 18,365 | 312,199 | 17 | 18,757 | -0.02 | |
| 16 | Philadelphia Union | 18,126 | 308,146 | 17 | 12,903 | 0.40 | 19,228 |
| 17 | Orlando City SC | 17,261 | 293,441 | 17 | 15,418 | 0.12 | 21,693 |
| 18 | NYC FC | 17,180 | 292,057 | 17 | 5,429 | 2.16 | |
| 19 | New York Red Bulls | 17,002 | 289,035 | 17 | 13,161 | 0.29 | 23,672 |
| 20 | FC Dallas | 16,469 | 279,965 | 17 | 13,063 | 0.26 | 19,096 |
| 21 | Houston Dynamo | 16,426 | 279,240 | 17 | 11,732 | 0.40 | 21,284 |
| 22 | Vancouver Whitecaps | 16,399 | 278,790 | 17 | 10,741 | 0.53 | |
| 23 | D.C. United | 16,256 | 276,355 | 17 | 12,715 | 0.28 | 19,325 |
| 24 | CF Montreal | 15,905 | 270,383 | 17 | 5,000 | 2.18 | |
| 25 | Chicago Fire | 15,848 | 269,410 | 17 | 10,443 | 0.52 | 14,357 |
| 26 | San Jose Earthquakes | 15,260 | 259,416 | 17 | 13,171 | 0.16 | |
| 27 | Colorado Rapids | 14,473 | 246,049 | 17 | 11,551 | 0.25 | |
| 28 | Inter Miami CF | 12,637 | 214,833 | 17 | 13,847 | -0.09 | 30,863* |
| TOTALS | 21,006 | 9,956,823 | 474 | 16,910 | 0.24 | 365,079 | |
| WEEKLY AV. | 22,817 |
* Total of two matches
Are you a subscriber to the free weekly Soccer Stadium Digest newsletter? Sign up here!
