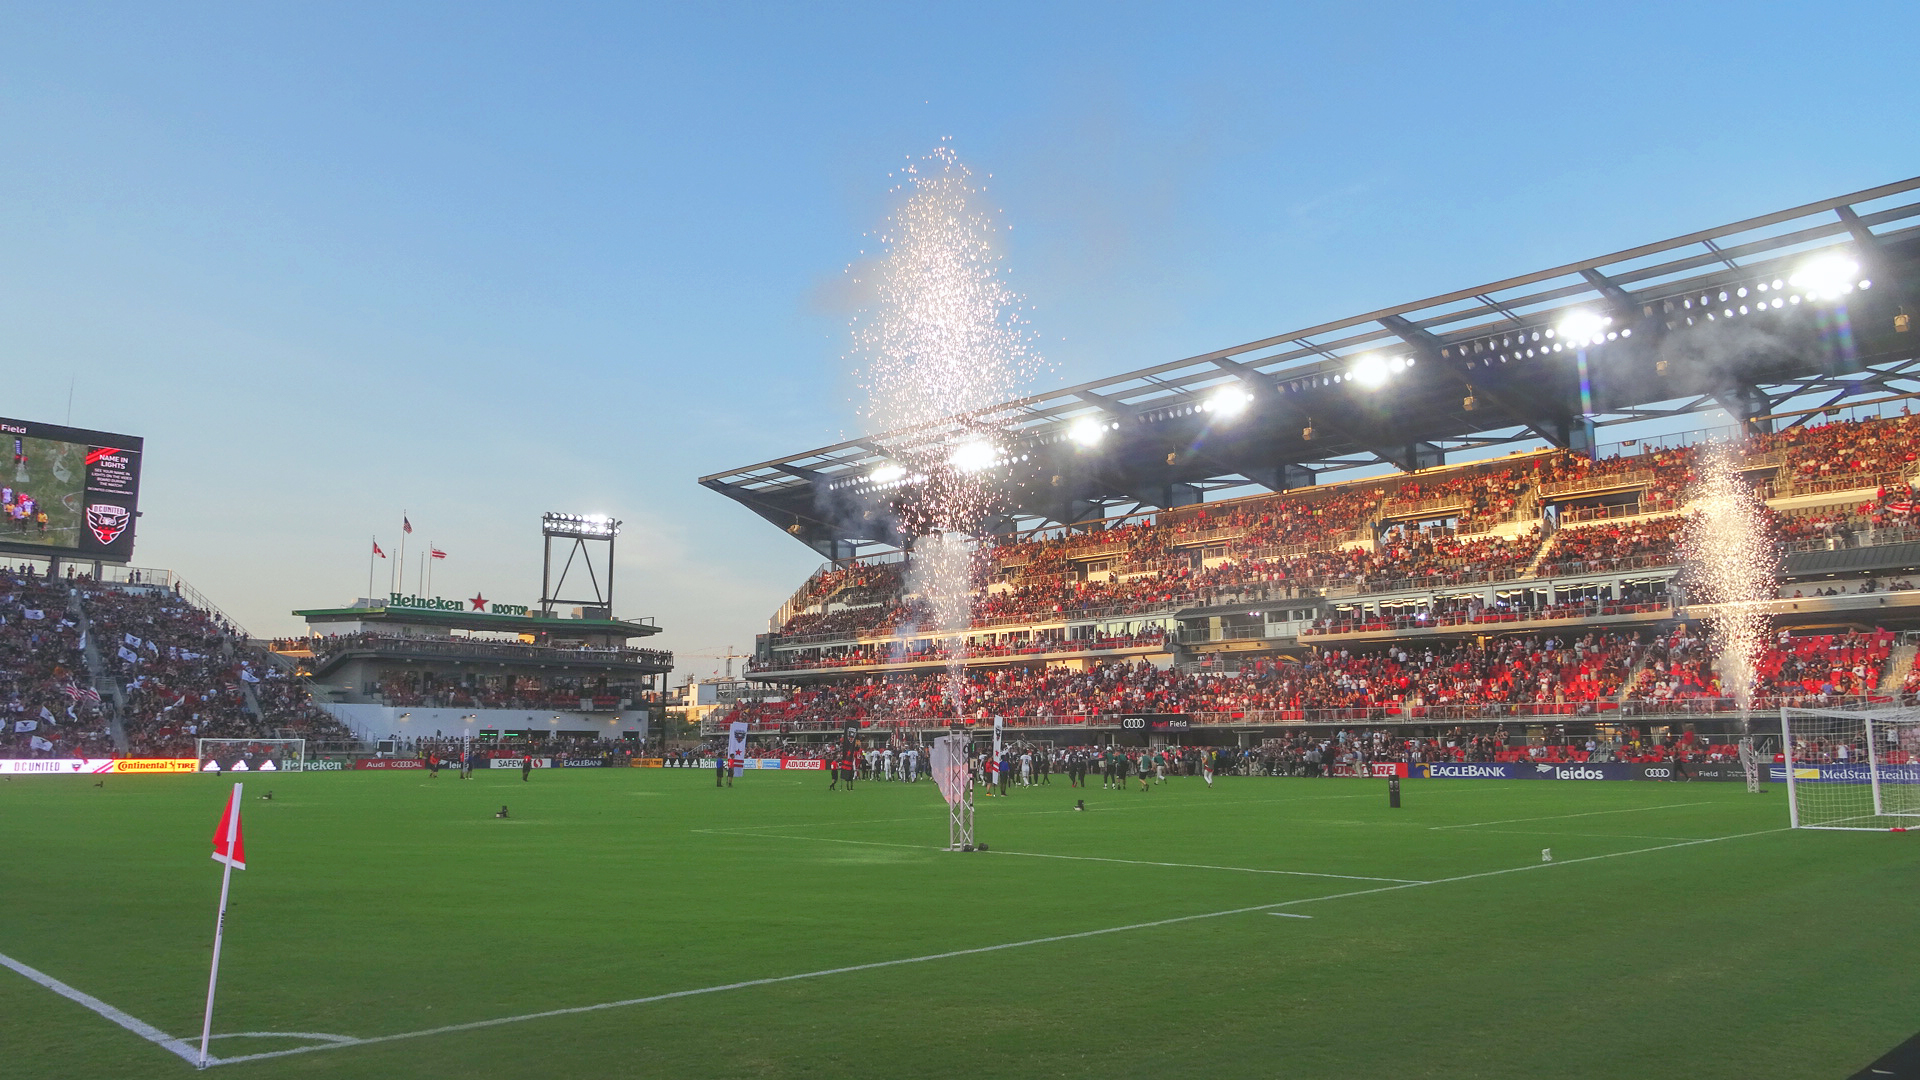
The strong finish to the season is reflected in the final 2018 MLS attendance figures for Week 35, as the circuit ends up just slightly down from 2017’s per-game average.
Here are the numbers to date for 2018 MLS attendance, as of October 28:
| Team | Av. | Total | Gms | 2017 | YOY | Week 35 | |
| 1 | Atlanta United FC | 53,002 | 901,033 | 17 | 48,200 | 0.10 | |
| 2 | Seattle Sounders | 40,641 | 690,893 | 17 | 43,666 | -0.07 | 42,617 |
| 3 | Toronto FC | 26,628 | 452,675 | 17 | 27,647 | -0.04 | 23,895 |
| 4 | LA Galaxy | 24,444 | 415,543 | 17 | 22,251 | 0.10 | 27,068 |
| 5 | Minnesota United | 23,902 | 406,342 | 17 | 20,538 | 0.16 | |
| 6 | Orlando City SC | 23,866 | 405,730 | 17 | 25,028 | -0.05 | |
| 7 | NYC FC | 23,211 | 394,583 | 17 | 22,643 | 0.03 | 26,441 |
| 8 | LAFC | 22,042 | 374,716 | 17 | NA | NA | |
| 9 | Vancouver Whitecaps | 21,946 | 373,089 | 17 | 21,760 | 0.01 | 25,348 |
| 10 | Portland Timbers | 21,144 | 359,448 | 17 | 21,144 | 0.00 | |
| 11 | Sporting KC | 19,950 | 339,148 | 17 | 19,536 | 0.02 | 20,702 |
| 12 | San Jose Earthquakes | 19,032 | 323,547 | 17 | 19,875 | -0.04 | |
| 13 | Real Salt Lake | 18,605 | 316,286 | 17 | 18,781 | -0.01 | |
| 14 | New York Red Bulls | 18,601 | 316,214 | 17 | 21,175 | -0.12 | 20,023 |
| 15 | Montreal Impact | 18,569 | 315,665 | 17 | 20,046 | -0.07 | |
| 16 | NE Revolution | 18,347 | 311,897 | 17 | 19,367 | -0.05 | 28,832 |
| 17 | D.C. United | 17,635 | 299,803 | 17 | 17,904 | -0.01 | |
| 18 | Houston Dynamo | 16,906 | 287,408 | 17 | 17,500 | -0.03 | |
| 19 | Philadelphia Union | 16,518 | 280,805 | 17 | 16,901 | -0.02 | |
| 20 | FC Dallas | 15,512 | 263,707 | 17 | 15,122 | 0.03 | |
| 21 | Colorado Rapids | 15,333 | 260,660 | 17 | 15,322 | 0.00 | 15,172 |
| 22 | Chicago Fire | 14,806 | 251,708 | 17 | 17,383 | -0.15 | 19,459 |
| 23 | Columbus Crew | 12,447 | 211,603 | 17 | 15,439 | -0.19 | 17,677 |
| TOTALS | 21,873 | 8,552,503 | 391 | 22,147 | -0.01 | 267,234 | |
| WEEKLY AV. | 24,294 |
Last week attendance totaled 383,622 fans in the most well-attended week for 2018 MLS attendance, as 15 matches generated some serious numbers. Those serious numbers continued to end the season, with a robust 24,294 fans per match in 11 matches. Almost every team outdrew their season average by healthy margins–welcome news for most of the teams in action. The most important stat when you look at the 2018 MLS attendance numbers: season attendance per match was only down 1 percent. Earlier this year attendance was down some 6 percent year over year thanks to horrendous weather plaguing the early season. This makes for a decent rally, to be sure.

